
Abstract
U.S. residential thermostats control approximately 9% of the nation’s energy use. Many building codes now require programmable thermostats (PTs) because of their assumed energy savings. However, several recent field studies have shown no significant savings or even higher energy use in households using PTs compared to those using non-PTs. These studies point to usability problems that lead to incorrect use and wasted energy. However, the lack of clear, consistent metrics has hampered the acceptance of usability concerns by thermostat manufacturers. Thus there is a need for metrics specific to PTs that manufacturers can use to evaluate their products.
In this paper, we report on the results of a usability study conducted on five commercially available PTs and the development of four new metrics suitable for use in evaluating thermostat usability. Our study confirmed usability deficits in the current generation of PTs and showed the metrics are correlated with each other as well as agreeing with the qualitative results of the study.
Practitioner’s Take Away
Our usability study confirmed a number of usability issues with current programmable thermostats (PTs) and identified four novel metrics that can be used to quantitatively evaluate the usability of PTs. Our results could be generalized to embedded devices in other domains where quantitative metrics are desired.
The following are key points from our research:
- PTs and other small appliances often exhibit poor usability.
- Manufacturers of such appliances often prefer quantitative measurements of usability to qualitative evaluations.
- The metrics we devised show reasonable correlations with each other and with the NIST industry standard while having the additional benefit of being normalized for easier interface comparison.
- Our four metrics contain several input options allowing manufacturers to freely choose between them based on convenience.
- Metrics that combine time-on-task with success/failure rates to yield a single usability score may have greater uptake among PT manufacturers.
- User satisfaction ratings alone are not a complete measure of usability when the device does not have sufficient and direct feedback on task success.
- Usability evaluations are recommended for future PT designs to realize energy savings.
Introduction
Thermostats have a considerable effect on energy use throughout the U.S. Research on programmable thermostats (PTs), in particular, points to the need for careful and consistent user interface design to realize energy savings in the U.S. (Meier et al., 2010). Recent studies estimate that U.S. residential thermostats control 9% of the nation’s energy use (Peffer, 2011). However, usability issues with modern PT design are leading to errors in operation and wasted energy, with a resulting effect on national energy consumption.
The EnergyStar™ endorsement program for PTs, which had been in place since 1995, was recently discontinued in December 2009 based on these and other results; EnergyStar™ is currently developing usability guidelines for PTs. A key issue in the establishment of these guidelines is the development of a means of measuring usability in thermostats that produces a single number that consumers can use to reliably and repeatedly compare device usability.
We conducted a usability study on five commercially-available residential programmable thermostat interfaces (three touchscreen, one Web, and one button-based), evaluating device usability and effectiveness. Our goal was to devise metrics to evaluate the devices’ usability and the users’ effectiveness at performing common thermostat tasks such as setting heating temperatures and programming weekly schedules. We developed, computed, and tested four novel metrics appropriate to thermostats and similar devices: Time & Success, Path Length, Button Mash, and Confusion. We conducted a statistical evaluation of these metrics and a comparison to standard usability metrics, including the efficiency metric specified by the Common Industry Format for Usability Test Reports (National Institute for Standards and Technology [NIST], 2001), the ratio of the task completion rate to the mean time per task, and Sauro and Kindlund’s (2005) Single Usability Metric (SUM).
We show that all metrics correlated with each other and corresponded with qualitative findings. Finally, we compared the new metrics with standard industry metrics.
One drawback of existing metrics is that many are not normalized to an absolute scale, but vary based on factors such as the maximum time taken by a user to perform a task. By applying the logistic function (Verhulst, 1838), our metrics were all normalized to the scale 0-1 and thus provided an absolute rather than a relative reference. Additionally, our four metrics offer manufacturers and standards organizations several options to compare device usability with a high degree of statistical significance.
We evaluated the metrics with a formal usability study conducted on five programmable thermostats (three touchscreen, one Web, and one-button based) with 31 participants and 295 trials involving five separate tasks.
In our usability test, we found that several of the PT interfaces were complicated and difficult for users to understand, leading to frustrations and major barriers for completing the tasks. Our metrics were able to clearly and objectively distinguish between more usable and less usable PT interfaces.
This paper reports the results of one of the few formal usability studies ever conducted on PTs, as well as the development and evaluation of four novel usability metrics specific to thermostats, appliances, and similar devices. These metrics could be applied to any user interface on a small screen with a relatively small number of buttons or a touchscreen.
Programmable Thermostats
Modern programmable thermostats (PTs) can be scheduled to automatically adjust the indoor temperature for heating or cooling during occupied hours as well as unoccupied or sleeping hours. The adoption of PTs has been strongly supported by the U.S. Department of Energy (DOE), the U.S. Environmental Protection Agency (EPA), and the California Energy Commission (CEC)1. The DOE estimated the average homeowner can save 10% on heating and cooling costs by using a PT to reduce heating and cooling during the night or periods when the house is unoccupied (U.S. Department of Energy [DOE], 2011). The EPA claims homeowners could save about $180 a year with a PT (2009). These predictions are qualified with terms like “effectively used” or “properly setting and maintaining those settings.” However, EPA’s EnergyStar™ program for PTs, which had been in place since 1995, was recently discontinued in December 2009. One of the reasons for this decision is that several recent field studies have shown no significant savings in households using PTs compared to households using non-programmable thermostats; indeed, some studies even showed that homes with PTs used more energy than those relying on manual thermostats (Cross & Judd, 1997; Haiad, Peterson, Reeves, & Hirsch, 2004; Nevius, & Pigg, 2000; Shipworth et al., 2010).
There is increasing evidence that many people do not operate PTs in an optimal manner, leading to unnecessarily high heating and cooling energy use. The user interfaces of many thermostats appear to be a major cause of confusion and errors leading to incorrect settings, failure to override programs, and failure to return to regular schedules after exceptions. Several surveys have shown that approximately half of installed PTs in the U.S. are in “hold” mode, which disables the programmed schedule (California Energy Commission [CEC], 2004; Decision Analyst, 2008). While some studies suggest part of the problem lies in misconceptions about energy in general and how thermostats work in particular (Rathouse & Young, 2004), many reveal that people find PTs difficult to program and to understand (Boait, & Rylatt, 2010; Consumer Reports, 2011; Critchleya, Gilbertsona, Grimsleya, Greena, & Group, 2007; Karjalainen & Koistinen, 2007; Meier et al., 2010; Nevius, & Pigg, 2000).
Most of these studies, however, are qualitative; little quantitative information is available on how people interact with these temperature and environmental controls. To our knowledge, the only comparative usability study on commercially available PTs was conducted by Consumer Reports in 2007 (Consumer Reports, 2011)2. Twenty-five different thermostats were lab-tested to assess their energy performance and their usability. As a result, PTs were ranked according to these criteria, and a series of problems with using thermostats were highlighted. Consumer Reports does not explicitly state what parameters were considered to assess thermostat usability, and it does not appear that quantitative tests were performed.
Manufacturers of PTs have traditionally preferred prescriptive guidelines to a formal usability testing process. One concern is that such usability evaluations may be overly subjective. In order to address this concern, we developed and tested a set of four consistent, normalized metrics specifically designed for devices such as PTs.
Related Work
While there are numerous models to measure and benchmark usability (Tullis & Albert, 2008), there has been little research on whether these metrics can be effectively applied to programmable thermostats and appliances or similar types of embedded devices (computing systems designed to perform only a specific dedicated task).
Babiker, Fujihara, and Boyle (1991) calculated a usability metric that combined objective and subjective measures, yet this metric was specific to hypertext systems.
Smith (1996) derived more robust metrics for measuring efficiency, confidence, and “lostness” (disorientation in an information space) of users of hypertext systems. These metrics offered several ratios comparing the number of different nodes (pages) necessary to complete a task to the actual number of nodes the user accessed. Such ratios, while helpful in normalizing the metrics, possess challenges when applied to thermostats or other embedded devices. Most notably, distinguishing different nodes does not translate easily to systems where the same functions might have different meanings depending on the state of the device.
Otter and Johnson (2000) built upon Smith’s work by adding link weightings to create what they depict as a more accurate hypertext lostness metric. These weightings are specific to the nature of hypertext and again rely on the different node paths.
More recently, Sauro and Kindlund (2005) devised a single summated usability metric (SUM) that combined objective and subjective metrics based on the ISO/ANSI dimensions of effectiveness, efficiency, and satisfaction to form a single score. Testing of this metric was done across several Windows and Web-based platforms, yet was not extended to other devices. The authors did note that their tests were domain specific and that there were possible limitations of the metric when applied to other interfaces or hardware (Sauro & Kindlund, 2005).
Murphy (1998) made necessary distinctions between usability considerations for embedded user interfaces and desktop applications. He noted that the embedded interface functions as a tool with specific ends and that the interface was vying for limited and diverse user attention spans.
The limited work that does reference the usability of embedded devices focuses on prescriptive design principles. Such principles include display size and touchscreen affordances (Murphy, 2001). While prescriptive evaluation methods are a helpful start for the designers of embedded systems, they can also stifle creative processes and these principles must continually be modified to keep pace with ever changing technology.
Given the state of the art of embedded system usability, we determined that there was a need for metrics specific to thermostats and similar devices, and thus designed and conducted a formal usability study on PTs to evaluate such metrics.
1The California Building Standards Code has required the installation of a setback or programmable thermostat in new and renovated residential construction since 1978.
2While PT manufacturers often state that they perform usability tests for their products, they do not disclose results because they consider the user interface a key marketing feature.
Methods
The thermostat usability study consisted of 31 participants (9 female, 22 male), ranging in age from 18 to 65. The primary method of recruitment was through online classified postings to sections for “creative gigs” and “labor gigs” in the San Francisco Bay area. Twenty-nine participants were recruited from this post while two were recruited from a similar posting to a university email list. All participants were given a financial incentive for taking part in the study. While participants were not screened to be representative of the United States demographic population, the recruitment postings did produce a range of participants from varied occupations and backgrounds including construction workers, business managers, non-profit staff, maintenance workers, and students. Any participants who worked in the design or manufacturing of thermostats were screened out of the study. Participants were asked to rate their previous experience with programmable thermostats. Seventeen people reported their experience level with programmable thermostats as “low,” eight as “moderate,” and five reported having “no experience with programmable thermostats” (one participant gave no response).
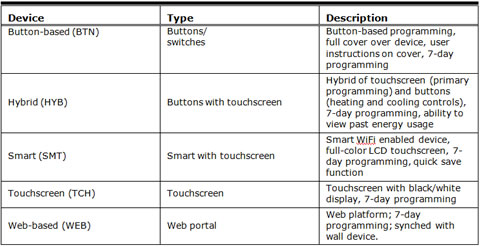
We tested five thermostat interfaces: three primarily touchscreen thermostats, one button-based, and one Web-based thermostat (Table 1). These devices were selected to represent a range of commercially-available devices and prices.
Table 1. Description of Thermostats Tested

The experimental design included both between-subjects and within-subjects variables. We identified five tasks that represented fundamental residential PT use cases in daily life.
Task Description
We developed a list of five tasks reflecting the important functionalities of PTs. These tasks were also chosen in consideration of their effect on residential energy efficiency.
Set Heat—Task 1
In this task users were asked to imagine it was winter and that they would like to set their thermostat to HEAT mode. The HEAT-OFF switch is a common control found in typical thermostats for at least the past 60 years. The setting was OFF at the start of the task.
Time & Day—Task 2
In this task users were asked to set the thermostat to the current day and time. The time settings were programmed to Monday at 12:00 a.m. for the start of the task. This task was not performed on the WEB thermostat because time settings could not be modified from the Web portal. Also, setting the day was excluded for the TCH device because this adjustment could only be performed with a settings code provided in the manual.
Current Settings—Task 3
In this task users were asked to identify and read aloud the temperature that the thermostat was set to reach at that current time.
Future Settings—Task 4
In this task users were expected to determine the temperature setting for a future period (Thursday at 9:00 p.m.) and to read this temperature aloud. They were specifically told that they did not need to change any of the temperature program settings but only identify the temperature already programmed.
Vacation/Hold—Task 5
In this task users were asked to imagine they were going on a five-day trip in the winter and needed to set their thermostat to maintain the same temperature during the time they were away. As long as the temperature was consistent for the five days, there was no additional value placed on the methods for which this task was achieved or the temperature selected.
Experimental Design
The thermostat interfaces (except WEB) were mounted on a wooden platform approximately 1.5 meters from the floor. Each participant performed the same five tasks on two of the five thermostat interfaces (Table 2). The interface order was randomized for each subject to account for possible learning effects, and all permutations were tested. In total 12 to 13 subjects performed the series of tasks on each interface over the course of the study. Each task was video recorded for researcher analysis.
Table 2. Experimental Design

*Task 2 TCH consisted of only setting the time not the date.
Two computerized surveys were administered prior to any interaction the subject had with the thermostat interfaces. The purpose of the surveys was to record the subjects’ age range as well as their self-rated experience level with programmable thermostat interfaces.
After subjects performed each task, they filled out a self-evaluation of their performance on that particular task. This computerized self-evaluation was based on the NASA Task Load Index (NASA, 2010) and consisted of four questions regarding users’ mental demand, performance, effort, and frustration levels on a 7-point scale from low (easy) to high (challenging).
Subjects were verbally informed that if they were unable to perform a task they could move on to the next task by informing the experimenter they were “not able to perform this task.” If subjects needed clarification on the task requirements or instructions, the experimenter was permitted to answer relevant questions, otherwise the experimenter was not permitted to talk or to assist the subject in any way during the course of the task.
Experimental Conditions
The study was conducted during the summer months in a lab setting in Berkeley, California. Subjects were specifically asked to imagine that it was winter and that they wanted to heat their residence. Heat mode was chosen instead of cool mode due to the temperate climate in Northern California in which residents would not necessarily have air conditioning. Subjects were reminded before each task that they should imagine it was wintertime in their home and that they should evaluate or select temperatures for heating.
A video recording of each session was used to input numerous categories of data including task completion, time on task, function path (buttons and function interactions), interaction motions (press, slide, hold, etc.), interaction errors, and experimenter observations regarding users’ confusion during the task.
A code for the buttons, functions, and interaction motions on each interface was developed for recording purposes.
Interaction errors were recorded as actions with no effect, or ane, defined as any action that did not change the state of the thermostat. The ane actions included failed attempts at opening the device’s cover or flap, touching text or icons that were not touch sensitive, pressing buttons or functions that did not change the device’s state within the current mode, and performing any interaction motion on the interface that did not change the state.
User confusion was recorded as any hesitation or pause (three seconds or greater) between functions. The experimenter also recorded all verbal expressions of the subject that could indicate confusion or an emotional response to the interface. These verbal observations included phrases that expressed confusion, task success, task failure, extreme exasperation, or surprise.
Description of the Metrics
In developing our metrics, we had two primary aims in mind. First, we wished to capture the unique elements of user behavior when interacting with PTs, for example, how users deal with a constrained number of buttons/controls that require the implementation of multiple system modes or with small screens mounted in inconvenient locations. Second, we wished to develop metrics that would be acceptable to thermostat manufacturers and provide them with some choice in how they record and measure usability. A usability metric must be itself usable to facilitate widespread adoption. A common drawback of many usability metrics involving task duration or number of steps to complete a task is that the value of the metric is unbounded and varies from task to task. This creates a difficulty; the metric cannot be compared on an absolute scale from one task or device to another. This challenge was recognized by Sauro and Kindlund (2005) when they devised their SUM metric. However, the NIST standard efficiency metric does have the drawback of being unbounded (NIST, 2001).
An unbounded metric would be difficult to use in a program such as EnergyStar™ run by the EPA. The EPA and manufacturers need to define a single measure of usability to facilitate consumer understanding and to create an absolute scale of usability that is not dependent on arbitrary task length.
Additionally, our four metrics each have different inputs that are all highly correlated. This offers manufacturers several diverse options in selecting a metric most appropriate to their available resources and testing environment, whether in a usability lab or remotely.
Metric Development
In order to create such metrics, we decided to utilize the logistic function (Verhulst, 1838):
![]()
The logistic function is a sigmoid curve, commonly used in a variety of applications across multiple fields. It is often employed for the normalization of data, as it maps the real line ![]() to the interval (0, 1). Thus an unbounded domain can be mapped to a finite range. Because our data was non-negative but had an unbounded upper limit, and because higher task durations or path lengths were “worse” than lower ones, we chose a variant of the logistic function
to the interval (0, 1). Thus an unbounded domain can be mapped to a finite range. Because our data was non-negative but had an unbounded upper limit, and because higher task durations or path lengths were “worse” than lower ones, we chose a variant of the logistic function
![]()
that maps ![]() to the interval [1, 0). In other words, a shorter time on task or path length is mapped to a value close to 1, and a longer time or path length would be mapped to a value closer to 0.
to the interval [1, 0). In other words, a shorter time on task or path length is mapped to a value close to 1, and a longer time or path length would be mapped to a value closer to 0.
Additionally, we wished to account for success rates on a per-trial basis (where a task “trial” is a single instance of a participant performing a task on a thermostat model, also sometimes called a “task observation”) rather than averaging over all trials of a given task. In order to accomplish this, we incorporated the task completion or success rate variable, s, directly into our primary equation, which we called the “M” statistic. The M statistic is calculated for each metric i as follows on a per-trial basis:
![]()
where
![]()
![]()
Note that Mi will always be normalized between 0 and 1. The distinguishing variables for each metric will be defined later in this section.
The success rate variable, s, also always falls between 0 and 1. It can be a binary variable (where s = 1 if the task is completed and 0 otherwise), have multiple values for partial success (e.g., if the task has several subparts that can be completed successfully), or be a continuous variable that measures percentage of task completion. For the purposes of the metrics evaluated in this paper, s is always either a binary (s = 0 or 1) or a trinary variable (s = 0, 0.5, or 1).
Note that the M-statistic combines time on task with success of the trial in an intuitive manner: If the task is not completed so that s = 0, the value of the M-statistic is 0. Intuitively, this means that if the task was not completed, it should not matter how long the user spent attempting it; it is still a failure. If, on the other hand, the task is completed successfully, then the time on task (or other distinguishing variable such as path length) weighs into the M-statistic. For example, a shorter task duration will yield a higher value of M, a longer task duration will yield a lower value of M, and an uncompleted task will set M = 0.
The distinguishing variable in the M-statistic equation, xi, is defined differently for each of the four metrics. The metrics are named Time & Success, Path Length, Button Mash, and Confusion. Note that “good” values of each of these metrics are close to 1, and “bad” values are close to 0. In addition, an empirically determined scaling factor, ki, was incorporated into each metric to maximize data dispersion. Because the metric values changed based on units chosen (hours vs. minutes, for example), we selected constant k-values empirically in order that the data would spread evenly over the entire 0-1 range and enable straightforward comparison of the metrics.
Finally, to compute the value of the metric, the M-statistic is computed over all trials and all tasks for a particular device model. These values are then averaged to produce the final metric value. The four metrics and their distinguishing variables are described in detail below.
Time & Success
For the Time & Success metric, the distinguishing variable was the time on task, t, measured in seconds. Starting time commenced when users were told by the experimenter to begin. End time was defined as the point at which subjects either verbally confirmed they had completed the task or verbally confirmed that they were unable to complete the given task.
![]()
where
t = time for subject to complete the task (seconds)
k1 = 50 (empirically determined constant)
Path Length
For the Path Length metric, the minimum path length, m, was defined as the shortest function path (e.g., series of button presses if the device had buttons) that a user could invoke to successfully accomplish a given task. Whenever possible, this path was determined by using the path given in the device user’s manual. The actual number of functions (e.g., buttons, actions such as opening cover) used, f, was calculated as the number of functions the user attempted while trying to complete a task. This included actions that were not successful, such as when a user attempted to press an area of the device that was not touch sensitive.
![]()
where
f = number of buttons (functions) user actually acted upon
m = minimum number of buttons (functions) required to complete the task
k2 = 5 (empirically determined constant)
Button Mash Effect
The determining variable for this metric was the sum of the number of times the user attempted to interact with the interface without actually changing the state or programming of the device. This number was also termed interaction errors or actions with no effect, ane. We named this metric the Button Masheffect due to the manner in which the mental state of the user at times appeared to mirror the common gaming phenomenon known as “button mashing,” in which a gamer, often a novice, presses any or all buttons possible in a frenetic attempt to affect their progress in the game (Murphy, 2004). The interaction errors similarly reflect users’ lack of understanding of how functions on the device or screen would affect their progress in a task.
![]()
where
ane = number of actions with no effect
k3 = 5 (empirically determined constant)
Confusion
The distinguishing variable of the Confusion metric was the total number of hesitations, h, that users incurred over the course of a task. A hesitation was defined to consist of a pause or stop in user interaction for three seconds or longer. A pause was considered an indication that the user was uncertain of the next steps to complete the task.
![]()
where
h = sum of count of user hesitations ≥ 3 seconds
k4 = 2(empirically determined constant)
Results
The following Figures 1-4 depict the mean values for all thermostat models over five tasks for each of the four metrics, with error bars at the 95% confidence level. An analysis of variance (ANOVA) showed that for the Time & Success metric, the effect of thermostat model on usability was significant F(4, 290) = 15.3, p < .01. The effects were similarly statistically significant for Path Length, F(4, 290) = 20.6, p < .01; Button Mash, F(4, 290) = 12.7, p < .01; and Confusion, F(4, 290) = 16.2, p < .01.

Figure1. The Time & Success metric for all thermostats

Figure 2. The Path Length metric for all thermostats

Figure 3. The Button Mash metric for all thermostats

Figure 4. The Confusion metric for all thermostats
The metrics we developed provided an identical ranking of the interfaces (with the exception of the Path Length metric for which TCH and SMT were essentially equal or within .0009). There was some difference in the values of the individual metrics, demonstrating that they are likely to be equivalent in practice. We also show a close correlation between our metrics later in this section. Our metrics ranked the thermostats in order of most usable to least usable as follows: the Web-based thermostat, WEB, was ranked the highest, followed by the touchscreen, TCH, then the “smart” thermostat, SMT. Significantly lower ranked was the button-based thermostat, BTN, with the hybrid model, HYB, coming in last.
Comparison with NIST Metric
This metric is defined in the Common Industry Format for Usability Test Reports (NIST, 2001); it is the ratio of the task completion rate to the mean time per task. While it is interesting to note that the NIST metric produced the same ranking of thermostats and was highly correlated, there were several drawbacks to using it as a benchmark (Figure 5). One challenge was that we could not determine statistical significance due to the nature of the NIST metric, which was averaged over all participants. An additional drawback of the NIST metric was that it varied based upon the mean completion time per task. Thus this metric was only suitable for relative comparisons within a single usability test.

Figure 5. The NIST metric for all thermostats
Comparison with SUM Metric
Sauro and Kindlund (2005) defined a SUM that produces a single value, scaled from 0 to 1, and that combines time, completion, satisfaction, and error rate. We are not aware of any published work applying the SUM to usability of PTs, appliances, or other embedded devices. The authors do acknowledge the importance of testing their metric on additional interfaces and hardware beyond desktop software applications.
We computed the SUM metric on our data using Sauro’s spreadsheet at measuringusability.com. The ranking of interfaces was similar (with the exception of the ordering of TCH and SMT), yet we were not able to obtain statistically significant results on our data given the close score of most of the interfaces. Figure 6 shows the SUM with error bars at the 95% confidence level.
Given the manner in which the SUM spreadsheet calculates the error rate and based on feedback we received from Sauro (personal communication, May 13, 2011), it was necessary to cap the number of errors to be no greater than the error opportunities for each task.
On PTs it may not be possible to accurately capture some of the idiosyncrasies of the interface with the SUM metric, hindering our ability to obtain useful results. One primary example of this is the inclusion of the user satisfaction rating within the SUM. We found that users often did not receive clear feedback on whether they had successfully completed a task from the interface itself and therefore their satisfaction score did not necessarily reflect an actual outcome on the device. The potential challenges with user satisfaction as an accurate usability measure for PTs is further discussed in the Task Load Evaluations section.

Figure 6. The SUM metric for all thermostats
Expert Evaluation
Each thermostat underwent a subjective evaluation by a usability expert applying a set of heuristics (Nielsen & Molich, 1990) to rate the usability of the device in performing all tasks. The evaluator scored each task on a Likert scale of 1-5 where 1 was defined as fairly easy and 5 was highly difficult to use. The scores for each thermostat were then averaged and scaled to 0-1 to produce a relative ranking among devices (Figure 7). The expert evaluation ordering did differ slightly from the metrics we established (Time & Success, Path Length, Button Mash, and Confusion) as the SMT and BTN switched in the ranking placing the SMT in a lower position. This shift could possibly be attributed to a considerably lower score given to SMT in Task 2 (Time & Day). In this task the expert noted that the icons to change the date and time were hidden behind additional controls making it especially challenging for users to find them. Without the inclusion of Task 2 in the expert evaluation the order matches the ordering of our four new metrics exactly.
The Web-based system, WEB, scored higher according to the usability evaluation due to clearly labeled HVAC controls and temperature settings that were easily visible on the home screen display of the platform. The hybrid touchscreen and button thermostat, HYB, scored poorly due to controls hidden by a plastic cover, inconsistent distinctions between touch and non-touch sensitive areas of the display, and lengthy function paths.

Figure 7. Expert evaluation for all thermostats
Task Load Evaluations
After each task users were asked to provide their own subjective evaluation of the device in a series of four questions regarding mental demand, performance, effort, and frustration. Questions were modeled on the NASA Task Load Index (TLX) and consisted of a Likert scale from 1 (easy) to 7 (difficult). While the users’ self-reported evaluation of the devices matched our metrics to some degree, with the WEB and TCH receiving a stronger ranking and the HYB receiving the lowest score, there was not a significant variation among the device scores themselves as shown in Figure 8.
One possible explanation for the perceived lack of differentiation between devices was that users did not have direct feedback on whether or not they had successfully completed each task. When comparing users’ self-evaluation of performance with their actual completion the correlation was .53, showing that users’ perception of performance did not necessarily match actual performance on the device. This difference in perception was further supported by the fact that 35% of the users who were unable to complete the task gave themselves a strong performance rating (1-3 on a 7-point scale with 1 being perfect). Many times users that successfully completed tasks seemed no more certain of their success than those who did not complete the task. One participant commented, “I’m not sure if I got it” after he had in fact completed Task 5 successfully for BTN. Another user for the same task and using the same device remarked he was “done” with the task (setting the device to hold) when in fact he had set the WAKE temperature to 70 degrees and had not touched the hold function.

Figure 8. Users self-reported score averaged for each device
Correlation of Metrics
We computed a Pearson’s correlation of our four metrics, the NIST metric, the SUM metric, an expert evaluation of PT usability, and the NASA Task Load Index (TLX). Our four new metrics were all highly correlated with each other (≥0.96), as seen in Table 3. Our metrics were also strongly correlated with the NIST and an expert’s evaluation. Our metrics not only show high accuracy but also offer organizations several options for evaluating the usability of an interface.
Table 3. Correlations Among the Seven Metrics

Discussion
The need for a normalized metric that could enable thermostat manufacturers and standards agencies to compare the usability of PTs across a wide variety of functional designs was a driving factor for this research. When conducting a formal usability study, one is often confronted with a bewilderingly vast array of data, and, as Sauro and Kindlund (2005) have pointed out, there is a need to digest and simplify it for human understanding.
To illustrate this principle, we discuss some of the results of our data analysis. In the initial analysis of a small subset of our data, the time on task and completion rate for a single task (the Set Heat task), we produced the graphs displayed in Figure 9.

Figure 9. Elapsed time and completion rates for the Set Heat task
A question we have often seen discussed (with differing answers) in guidelines for measuring usability is “Do we look only at successful tasks when measuring time on task?” (Tullis & Albert, 2008). We were faced with a set of both successful and unsuccessful tasks in this case; it appeared to us that ignoring the uncompleted tasks would skew our data, yet including time on task for both successful and unsuccessful tasks would be comparing apples to oranges (note the different ranking of the thermostats in Figure 9 based on merely averaging time on task across all trials).
In order to make sense out of the data and to provide clear guidelines for manufacturers or government programs such as EnergyStar™, we wished to combine the time on task values with task completion values and produce a single, normalized metric that could be defined on an absolute scale. This ultimately led to our selection of the logistic function to normalize our data and to our use of a combined time and success metric.
We selected the four metrics of Time & Success, Path Length, Button Mash, and Confusion to examine a diverse set of performance measures benchmarking thermostat usability. Metric variables such as completion and time on task, which form the basis of our Time & Success metric, are standard industry measurements for usability (NIST, 2001). The three additional metrics, while highly correlated to Time & Success, offer several different options for evaluating an interface.
We considered the Path Length metric relevant to embedded systems such as thermostats given the importance of function accuracy to accomplish a task. In hypertext a user that has gone down the wrong path might be unable to accomplish the task, but the system itself is often left in the same condition as before the user attempted the task (Otter & Johnson, 2000; Smith, 1996). In an embedded device such as a thermostat, the wrong path can lead to drastically different states or modes than the user intended, and users can continue down a wrong path, receiving little feedback from the thermostat display. This was exemplified in a previous research study on PTs when a user attempting to set the clock time mistakenly programmed the morning WAKE schedule and thus inadvertently changed her temperature settings (Meier et al., 2010). Such errors can have substantial effects on energy usage. The Path Length metric offers a way to note the severity to which users deviate from the recommended or ideal function path so that these errors can be avoided early in the design process.
The Button Mash metric provides a way to gauge user confusion over system affordances and also offers insight into some of the unique usability challenges of PTs, appliances, and other embedded systems. The sum of interaction errors reflects whether a user’s mental model of the system matches with the actual affordances of the system. While industry principles for touchscreen graphical user interface (GUIs) have encouraged appropriate affordances, such as distinguishing touch sensitive and non-touch sensitive areas of the display (Murphy, 2001), there is as yet little consistency of affordance design among thermostats. Prescriptive design principles are helpful in elucidating some of these affordances to a user, but given the rapid pace of development in GUIs and the increasingly broad types of interactions designed for embedded systems (touch, gesture, voice, sound, etc.) it would be difficult to employ a one-size-fits-all prescriptive model. The Button Mash metric offers a way to test whether a user understands a diverse set of affordances.
Similarly, the Confusion metric can be applied to a wide variety of embedded system interfaces to achieve the same result. By recording the user pauses (over three seconds) we were able to quantify users’ level of insecurity and confusion regarding their next steps to accomplish a given task. Three seconds was selected as the threshold based on previous research on user hesitations suggesting this was the minimum amount of time of inactivity that would indicate user confusion or difficulty (Reeder & Maxion, 2006).
Measuring the usability of embedded systems that are not located on a PC is particularly important given the limited attention users often have for the interface (Murphy, 1998). Our four metrics not only offer a simple, normalized manner to evaluate the usability of PTs within a usability lab but can also be applied remotely to evaluate real-time user interactions with a device. While the Time & Success metric might be best suited to a lab environment where time can be discretely measured, the Path Length and Button Mash metrics are not time dependent and would be appropriate for use by companies recording data remotely from Web-connected PTs.
Future Research Opportunities
Due to the ubiquity of PTs and the dearth of usability metrics in this area, there is a clear need for further work in the field. There were many areas of interest that became apparent during the course of our research that we would like to pursue further.
While the current data shows a strong correlation among our metrics as well as with NIST and an expert’s evaluation, we would like to conduct further studies to demonstrate the repeatability of these results. Because the primary impetus of this research was to provide an actionable test that manufacturers could apply to their own thermostats with minimal cost it is important to ensure third-party verification of results. This is especially relevant given the use of these metrics to inform EPA EnergyStar™ usability standards. There is further potential for the metrics to be applied to a host of embedded systems to reduce barriers to efficient energy usage.
As PTs and similar devices become more advanced, there is also more potential research that can be done regarding the automation of our testing procedure. As an example, manufacturers can capture functions using a simulator that could be uploaded directly into our metric for Path Length. This would require minimal effort on the part of manufacturers. Also, as a growing number of appliances become "smart" in their communications with other systems there is the possibility to measure real-time user performance as the product performs in the commercial market. Several thermostat manufacturers with WiFi enabled devices are already gathering information regarding system states and could easily capture data on the function path as well.
User comments and patterns in common errors provide additional insight into good and poor designs for thermostats. Some of these design choices are already a common part of good usability standards, including font size. As one user commented, “There are very small letters here; I’ll have to get my glasses,” while trying to read the instructions on the cover of the device. Other design choices are more specific to the growing use of small touch screens in embedded devices. This includes confusion regarding the touch sensitivity of icons. One user repeatedly touched blank, non-touch sensitive areas of the HYB screen while trying to complete Task 3. This action was not uncommon. There is much continued work that could be done to document design principles for thermostats and create a possible reference device for use by manufacturers.
Conclusion
Federal agencies such as the EPA and DOE, and programs such as EnergyStar™, are beginning to realize the impact that usability can have in achieving the nation’s energy savings goals. However, manufacturers of thermostats and other appliances are unlikely to accept non-quantitative standards for usability, and there does not yet exist such a standard metric in this domain. To this end, we developed a novel set of usability metrics specific to PTs, which could also be used on other embedded devices. Via a formal usability study of five thermostat models, we demonstrated that the metrics are effective at distinguishing devices based on usability and are highly correlated with each other—NIST, the industry standard, and with an expert’s subjective usability evaluation utilizing standard heuristics. Additionally the metrics are normalized to the interval [0, 1], enabling an objective standard across devices while offering manufacturers and organizations several different options for evaluating interface usability.
We have submitted these metrics to the EPA’s EnergyStar™ program with the goal of facilitating the uptake of usability engineering principles among manufacturers of thermostats, appliances, and other embedded devices. Ultimately, we hope to make a contribution to sustainability by contributing to the design of better tools that will enable individuals to make informed choices on issues such as reducing energy consumption.
References
- Babiker, E. M., Fujihara, H., & Boyle, C. D. B. (1991). A metric for hypertext usability. Proceedings of the 9th Annual international conference on Systems documentation, Chicago.
- Boait, P. J., & Rylatt, R. M. (2010). A method for fully automatic operation of domestic heating. Energy and Buildings, 42(1), 11-16.
- California Energy Commission (CEC). (2004). California Statewide Residential Appliance Saturation Study (No. 300-00-004). Sacramento: California Energy Commission.
- Consumer Reports. (2011). Programmable thermostats still need to get with the program. Retrieved on April 2011 from http://news.consumerreports.org/appliances/2011/04/programmable-thermostats-still-too-tough-to-program-study-finds.html
- Critchleya, R., Gilbertsona, J., Grimsleya, M., Greena, G., & Group, W. F. S. (2007). Living in cold homes after heating improvements: Evidence from warm-front, England’s home energy efficiency scheme. Applied Energy, 84(2), 147-158.
- Cross, D., & Judd, D. (1997). Automatic setback thermostats: Measure persistence and customer behavior, Chicago.
- Decision Analyst. (2008). 2008 American home comfort survey. Arlington: Decision Analyst.
- Environmental Protection Agency (EPA). (2009). Programmable Thermostats Web Page. Retrieved March 2010 from http://www.energystar.gov/index.cfm?fuseaction=find_a_product.showProductGroup&pgw_code=TH
- Haiad, C., Peterson, J., Reeves, P., & Hirsch, J. (2004). Programmable thermostats installed into residential buildings: Predicting energy savings using occupant behavior & simulation. Southern California Edison.
- Karjalainen, S., & Koistinen, O. (2007). User problems with individual temperature control in offices. Building and Environment, 42(8), 2880-2887.
- Meier, A. K., Aragon, C., Hurwitz, B., Mujumdar, D., Perry, D., Peffer, T., & Pritoni, M. (2010). How people actually use thermostats. Proceedings of the 2010 ACEEE Summer Study on Energy Efficiency in Buildings, 2, 193-206.
- Murphy, N. (1998). Front panel: Designing software for embedded user interfaces. Lawrence, KS: R&D Books.
- Murphy, N. (2001). Usability for graphical user interfaces. EE Times (was Embedded Systems Programming). Retrieved August 2010 from http://www.eetimes.com/design/embedded/4023286/Usability-for-Graphical-User-Interfaces
- Murphy, S. (2004). Live in your world, play in ours: The spaces of video game identity. Journal of Visual Culture. Retrieved August 2010 from http://vcu.sagepub.com/content/3/2/223.short?rss=1&ssource=mfc
- National Atmospheric and Space Administration (NASA; Producer). (2010). NASA TLX: Task Load Index. Retrieved June 2010 from http://humansystems.arc.nasa.gov/groups/TLX/computer.php
- National Institute for Standards and Technology (NIST). (2001). Common industry format for usability test reports, version 2.0. Gaithersburg: NIST.
- Nevius, M., & Pigg, S. (2000). Programmable thermostats that go berserk: Taking a social perspective on space heating in Wisconsin. Proceedings of the 2000 ACEEE Summer Study on Energy Efficiency in Buildings, 8.233-238.244.
- Nielsen, J., & Molich, R. (1990, April 1-5). Heuristic evaluation of user interfaces. Proc. ACM CHI’90 Conf (pp 249-256). Seattle, WA.
- Otter, M., & Johnson, H. (2000). Lost in hyperspace: Metrics and mental models. Interacting with computers, 13, 1-40.
- Peffer, T., Pritoni, M., Meier, A. K., Aragon, C., & Perry, D. (2011). How People Use Thermostats: A Review. Building and Environment, 46(12), 2529-2541.
- Rathouse, K., & Young, B. (2004). RPDH15: Use of domestic heating controls. Watford: Building Research Establishment, UK.
- Reeder, R. W., & Maxion, R.A. (2006). User interface defect detection by hesitation analysis. Proc. of the 2006 International Conference on Dependable Systems and Networks, Philadelphia, PA.
- Sauro, J., & Kindlund, E. (2005). Using a single usability metric (SUM) to compare the usability of competing products. Proceedings of the Human Computer Interaction International Conference (HCII). Available at http://www.measuringusability.com/papers/HCII2005_sauro_kindlund-V9.pdf
- Shipworth, M., Firth, S. K., Gentry, M. I., Wright, A. J., Shipworth, D. T., & Lomas, K. J. (2010). Central heating thermostat settings and timing: Building demographics. Building Research & Information, 38(1), 50 – 69.
- Smith, P. (1996). Towards a practical measure of hypertext usability. Interacting with computers, 8(4), 365-381.
- Tullis, T., & Albert, B. (2008). Measuring the User Experience. Burlington: Elsevier, Inc.
- U.S. Department of Energy. (2011). Thermostats and Control Systems Web Page. Retrieved August 2011from http://www.energysavers.gov/tips
- Verhulst, P.-F. (1838). Notice sur la loi que la population poursuit dans son accroissement. Correspondance mathématique et physique, 10, 113-121.