
Abstract
A series of usability tests was run on two enterprise software applications, followed by verbal administration of the System Usability Scale. The original instrument with its 5-point Likert items was presented, as well as an alternate version modified with 7-point Likert items. Participants in the 5-point scale condition were more likely than those presented with the 7-point scale to interpolate, i.e., attempt a response between two discrete values presented to them. In an applied setting, this implied that electronic radio-button style survey tools using 5-point items might not be accurately measuring participant responses. This finding supported the conclusion that 7-point Likert items provide a more accurate measure of a participant’s true evaluation and are more appropriate for electronically-distributed and otherwise unsupervised usability questionnaires.
Practitioner’s Take Away
The following are the main findings of this study:
- Five-point Likert scales are more likely than 7-point scales to elicit interpolations in usability inventories.
- Interpolations are problematic because they cannot be mitigated within an electronic survey medium and require interpretation with facilitated surveys.
- Interpolations provide evidence that 5-point Likert scales may not be sensitive enough to record a usability test participant’s true evaluation of a system.
- Seven-point Likert scales appear to be sensitive enough to record a more accurate evaluation of an interface while remaining relatively compact.
- Seven-point Likert scales appear to be more suited to electronic distribution of usability inventories.
- Practitioners can quickly test Likert items through verbal protocols by using interpolations as a metric.
Introduction
The Information Technology department at Intel® Corporation has employed the System Usability Scale (SUS) for the subjective component of some of its internal usability evaluations. The SUS is a 10 item, 5-point Likert scale anchored with 1= Strongly Disagree and 5 = Strongly Agree and is used to evaluate a system’s usability in a relatively quick and reliable fashion (Brooke, 1996).
The SUS can be administered electronically, which is common in post-deployment situations where the researcher wants to conduct a usability evaluation with a large base of system users. During the system development phase, it may be administered manually, e.g., during usability testing or other validation activities. It is in these situations, where a facilitator elicits verbal responses or the participant responds with pen and paper, that otherwise hidden logistics issues may become apparent. Finstad (2006) noted that the language of the SUS doesn’t lend itself well to electronic distribution in international settings. Another issue that has emerged is the insensitivity of 5-point Likert items as evidenced by response interpolation. During the course of responding to the SUS, participants will not always conform to the boundaries set by the scaling. For example, instead of responding with discrete values such as 3 or 4, a participant may respond 3.5 verbally or make a mark on a survey sheet between 3 and 4. This interpolation may also be implicit, e.g., saying “between 3 and 4” with no exact value. From a scoring perspective, the administrator has a number of options, such as requesting that participants limit their responses to discrete integers. This puts the burden on participants to conform to an item that does not reflect their true intended responses. The administrator might also leave the responses as-is and introduce decimal values into an otherwise integer scoring system. In the case of implicit interpolation, an administrator might specify a value, e.g., assuming 3.5 to be a fair evaluation of what the respondent means by “between 3 and 4.” Additionally, the administrator might force an integer value by rounding the score to the more conservative (i.e., neutral-leaning) side of the item, in this case 3. Note that in this example, information is lost by not utilizing the respondent’s actual data. Even more data are lost with the most conservative option—discarding the response entirely. In any case, without insisting that the respondent choose a discrete value (and thereby forcing data loss), differences will emerge between such a manually-administered scale and an electronic one (e.g., equipped with radio buttons) that will not accept interpolated values.
The issue of data lost in this fashion, i.e., unrecorded due to the mismatch of the item to the respondent’s true subjective rating, has been touched upon in previous research. Russell and Bobko (1992) found that 5-point Likert items were too coarse a method for accurately gathering data on moderator effects. Instead, items approximating a more continuous distribution dramatically increased effect sizes as detected by moderated regression analysis. Essentially, the 5-point items were unable to capture the subtle degrees of measure the participants wanted to express. While some may argue that simpler items are motivated by potential issues with reliability, Cummins and Gullone (2000) made a case for higher-valued Likert items based on a lack of empirical evidence that expanded-choice Likert items are less reliable. Their final recommendation was a move towards 10-point items, because reliability and validity are not adversely affected by this expansion. Higher-order scales beyond this, however, can present complications. Nunnally (1978) also argued for higher order scales based on reliability. Adding scale steps provides a rapid increase in reliability, but begins to plateau at around 7 and provides little further increases in reliability beyond 11. Preston and Colman (2000) found that respondent test/retest reliability suffered in scales with more than 10 options. However, there are also arguments that 7 items may be optimal. Miller (1956, p. 4) noted that “psychologists have been using seven-point rating scales for a long time, on the intuitive basis that trying to rate into finer categories does not really add much to the usefulness of the ratings.” Lewis (1993) found that 7-point scales resulted in stronger correlations with t-test results. Diefenbach, Weinstein, and O’Reilly (1993) undertook an investigation of a range of Likert items, including 2-point, 5-point, 7-point, 9-point, 11-point, 12-point, and percentage (100-point) varieties. Subjective evaluations were measured, namely how easy the items were to use and how accurate they were perceived to be, i.e., the match between the items and the participant’s true evaluation. Quantitatively, the Likert items were evaluated via a booklet of questions about personal health risks, the scaled responses to which were compared to the participants’ rankings of 12 health risks at the beginning of the study. It was found that the 7-point item scale emerged as the best overall. Seven-point items produced among the best direct ranking matches, and were reported by participants as being the most accurate and the easiest to use. For comparison, the 100-point item scale performed well in direct ranking matches and test/retest reliability, but didn’t reach the 7-point item’s high marks for ease of use and accuracy. The 5-point item scale was slightly poorer than the 7-point item scale on all criteria, and significantly worse with subjective opinions. Essentially it was shown that “No scale performed significantly better than the seven-point verbal category scale on any criterion” in the two studies conducted (Diefenbach et al., 1993, p 189).
At a more general level, a comprehensive review of response alternatives was undertaken by Cox (1980). The review covered information theory and metric approaches as the most prevalent means for determining the optimal number of responses in an item. From information theory come the concept of bits (binary units) and channel capacity (Hmax), a monotonically increasing measure of the maximum amount of information in an item. An associated measure is H(y), response information, which indicates how much information is obtained by the responses to an item (Cox, 1980). H(y) has been empirically shown to increase, although at a slower rate than Hmax, as more response alternatives are made available. Although experiments organized around this information-theoretic approach have not provided conclusive evidence regarding the optimal number of item alternatives (Cox, 1980), some concepts have proven useful in metric approaches. One example is channel capacity which, usually through correlational reliability analysis, is the maximum variation that can be accounted for r2. Like Hmax, r2 increases monotonically and demonstrates that smaller response alternative sets return less information. Symonds’ work on reliability (as cited by Cox, 1980, p. 407) led him to conclude that seven was the optimal number of alternatives for items. At the end of the review, Cox concluded that the ideal number of item alternatives seemed to be centered on seven, with some situations calling for as few as five or as many as nine. Also of importance was that an odd number of alternatives, i.e., allowing for a neutral response, were preferable (Cox, 1980).
For the purposes of this investigation, one finding in particular stands out. Osgood, Suci, and Tannenbaum (1957) reported that, in the course of running studies with a variety of response alternative possibilities, seven emerged as their top choice. It was found that the 9-point items, the three discriminative steps on either side of the neutral option (and between the anchors), were used at consistently low frequencies. With 5-point Likert items, participants were irritated by the categorical nature of the options. Prior to the advent of electronic survey methods distributed without a facilitator, this may not have prevented too much of a logistical problem. A facilitator can remind participants of the constraints of the instrument and make decisions about coding in the analysis phase of a study based on a participant’s response. In an electronic setting, survey responses commonly take the form of radio button controls for each number. When participants are confronted with a set of discrete options that are not aligned with their true subjective evaluation, data loss occurs because the instrument is not sensitive enough. For example, a response intended to be 3 1/2 loses half a point of data as the participant is forced to choose either 3 or 4. Consequently, perhaps the ideal Likert item is the one that gathers just the right amount of information (i.e., is as compact and easy to administer as possible) without causing the respondents to interpolate in manually administered surveys or alter their choices in electronic ones. It is from this perspective that the following experiment was developed.
Participants
Participants consisted of 172 Intel® employees involved in the usability testing of two enterprise software applications. Eighty-four participants were surveyed in a series of tests involving a procurement application, and 88 participants were surveyed in a series of tests involving a workforce management application. Both usability tests were international in scope, with participants from the United States, England, Russia, China, the Philippines, Malaysia, Germany, the Netherlands, Ireland, and Israel.
Materials
Two versions of the SUS were used in usability testing. One was the standard SUS as described by Brooke (1996), a 5-point Likert scale. This scale was used in the testing of the workforce management application. An alternate 7-point scale version of the SUS, with 7 as Strongly Agree instead of 5 but otherwise unchanged, was used in the testing of the procurement application. This experimental 7-point version of the SUS was developed only to ensure that findings were due to the scale and not the wording in the instrument. The conditions were not alternated within software application because consistent scoring was required for the usability evaluations.
Procedure
Each participant engaged in a series of tasks involving the respective enterprise application being tested. At the conclusion of usability testing, each participant was given a verbally-administered version of the SUS, featuring either 5-point or 7-point Likert items. Participants read each survey item out loud and verbally indicated their response. The facilitator recorded their responses for later analysis exactly as voiced, i.e., regardless of interpolation. At the conclusion of the study the participants were debriefed, thanked for their participation, and released.
Results
The dependent measure in this study was the frequency of respondent interpolations, defined as a response outside the bounds of the values inherent to the Likert items presented to participants. Interpolation was counted as an all-or-nothing event, e.g., responses such as 3.5, 3 1/2, and between 3 and 4 were all counted as equivalent interpolations.
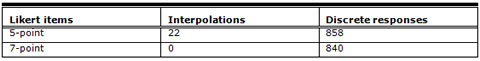
The data were first analyzed as a function of total interpolations, regardless of their source. Some participants demonstrated a predisposition towards interpolating and did so more than once during the course of the survey. Standard questionnaire replies where the participant did not interpolate were scored as discrete responses. These results appear below in Table 1.
Table 1. Interpolations vs. discrete responses

A Fisher’s Exact Test run on these data revealed that the 5-point Likert items elicited a significantly higher number of interpolations than the 7-point items (p < .01). These data were also analyzed from another perspective to control for the effects of multiple interpolations by the same participant. Instead of focusing on the number of interpolations that occurred throughout the usability testing, the total number of participants engaged in interpolation was the metric of interest. For this analysis, the participants themselves were coded as either interpolators (committing one or more interpolations) or discrete responders (committing no interpolations). Table 2 illustrates the findings.
Table 2. Interpolators vs. discrete responders

Once again, a Fisher’s Exact Test was employed and a significant difference emerged (p < .01), showing that participants were more likely to interpolate in the 5-point condition.
Recommendations
Five-point Likert items are apparently not sensitive enough to capture a usability test participant’s true evaluations and are thus more likely to elicit attempts at responses outside the confines of the instrument. When a questionnaire with such an item is administered in person, the impact may be reduced because the facilitator can opt to request that respondents alter their responses to fit the categories. However, for an electronically-distributed survey with 5-point Likert items, the practical implication is that it may not be able to adequately capture data. For participants whose true subjective evaluation of a survey item is not expressed as a valid option, the only recourses are to choose a different, inaccurate response, or ignore the item entirely. The skipping of an item, in survey tools that don’t strictly regulate and validate responses, may cause more serious data loss in the form of missing cases. This becomes especially problematic in an instrument like the SUS where the scores are summed into a composite final score, as any discarded responses invalidate the entire response set for that participant. Conversely, there are negative implications for single-item usability evaluations. Sauro and Dumas (2009) noted the possibility for errors that might be introduced with a small number (five or seven) of discrete Likert responses, and noted that computerized sliding scales can allow for higher sensitivity. Their study did conclude that a single post-test, 7-point Likert item can be a sensitive and robust measure. This current research would predict that a similar 5-point single item evaluation would not perform as well, as errors (evidenced by interpolation) are significantly more likely to occur with 5-point scales. The data lost in a 10-item instrument like the SUS (through insensitivity, not missing cases) may be negligible, but if a usability evaluation relies on just one data point the impact is much greater. During the course of evaluating the appropriateness of such a single-item scale, the measure of interpolation itself can be used to quickly pilot test whether a Likert item is likely to elicit a measurement error.
It appears that a 7-point Likert item is more likely to reflect a respondent’s true subjective evaluation of a usability questionnaire item than a 5-point item scale. When one considers previous research and how it bears on the balance between sensitivity and efficiency (Diefenbach, Weinstein, & O’Reilly, 1993; Russell & Bobko, 1992), the 7-point item scale may represent a “sweet spot” in survey construction. That is, it is sensitive enough to minimize interpolations and is also compact enough to be responded to efficiently. In fact, the results of this study can be seen as a behavioral validation of the subjective results found in Diefenbach et al. (1993). In that study it was found that the 7-point item excelled not only in objective accuracy but also in perceived accuracy and ease of use.
The perception of accuracy is also very important here, as participants ranked 5-point items lower due to this subjective lack of accuracy. This feeling about 5-point items, that the categories available do not match the respondent’s true evaluation, may be manifested behaviorally as interpolations when the opportunity is present. Conversely, the lack of such behavior in this study’s 7-point item condition reflects the higher perception of accuracy seen in Diefenbach et al. (1993).
Conclusion
Taken as a whole, the case for 5-point Likert items has been further weakened. It has been found that they provided too coarse an estimate of moderator effects (Russell & Bobko, 1992), and they were outperformed consistently by 7-point Likert items in objective rank matches and subjective evaluations (Diefenbach, Weinstein, & O’Reilly, 1993). This study has shown that 5-point items were more likely than 7-point items to elicit attempts to violate the prescribed boundaries of an item, a behavioral expression of the frustration noted by Osgood, Suci, and Tannenbaum (1957). Consequently the 5-point items were more prone to contribute to inaccurate measures through subtle but repeated data loss, especially when utilized in an electronic, non-moderated format. Seven-point Likert items have been shown to be more accurate, easier to use, and a better reflection of a respondent’s true evaluation. In light of all these advantages, even when compared to higher-order items, 7-point items appear to be the best solution for questionnaires such as those used in usability evaluations. Whether usability practitioners are developing a new summative scale, a satisfaction survey, or a simple one-item post-test evaluation item it would serve them well to use a 7-point rather than a 5-point scale.
References
- Brooke, J. (1996). SUS: A "quick and dirty" usability scale. In P. W. Jordan, B. Thomas, B. A. Weerdmeester, & A. L. McClelland (Eds.) Usability Evaluation in Industry (pp. 189-194). London: Taylor and Francis.
- Cox III, E. P. (1980). The optimal number of response alternatives for a scale: A review. Journal of Marketing Research, 17. 407-422.
- Cummins, R.A., & Gullone, E. (2000). Why we should not use 5-point Likert scales: The case for subjective quality of life measurement. Proceedings, Second International Conference on Quality of Life in Cities (pp.74-93). Singapore: National University of Singapore.
- Diefenbach, M.A., Weinstein, N.D., & O’Reilly, J. (1993). Scales for assessing perceptions of health hazard susceptibility. Health Education Research, 8, 181-192.
- Finstad, K. (2006). The System Usability Scale and non-native English speakers. Journal of Usability Studies, 1(4), 185-188.
- Lewis, J. R. (1993). Multipoint scales: Mean and median differences and observed significance levels. International Journal of Human-Computer Interaction, 5(4), 383-392.
- Miller, G.A. (1956). The magical number seven, plus or minus two: Some limits on our capacity for processing information. Psychological Review, 63, 81-97.
- Nunnally, J. (1978). Psychometric theory. New York: McGraw-Hill.
- Osgood, C. E., Suci, G., J., & Tannenbaum, P. (1957). The measurement of meaning. Chicago: University of Chicago Press.
- Preston, C.C., & Colman, A.M. (2000). Optimal number of response categories in rating scales: Reliability, validity, discriminating power, and respondent preferences. Acta Psychologica, 104, 1-15.
- Russell, C., & Bobko, P. (1992). Moderated regression analysis and Likert scales: Too coarse for comfort. Journal of Applied Psychology, 77, 336-342.
- Sauro, J., & Dumas, J. S. (2009). Comparison of three one-question, post-task usability questionnaires. In Proceedings of CHI 2009 (pp. 1599-1608). Boston, MA: ACM.